Report
By Desktale, you can always keep track of the number of open and closed tickets created internally by Users (contributors) and externally (by your customers or stakeholders); in addition, you can monitor the ongoing activity of your Organization's Communication Channels.
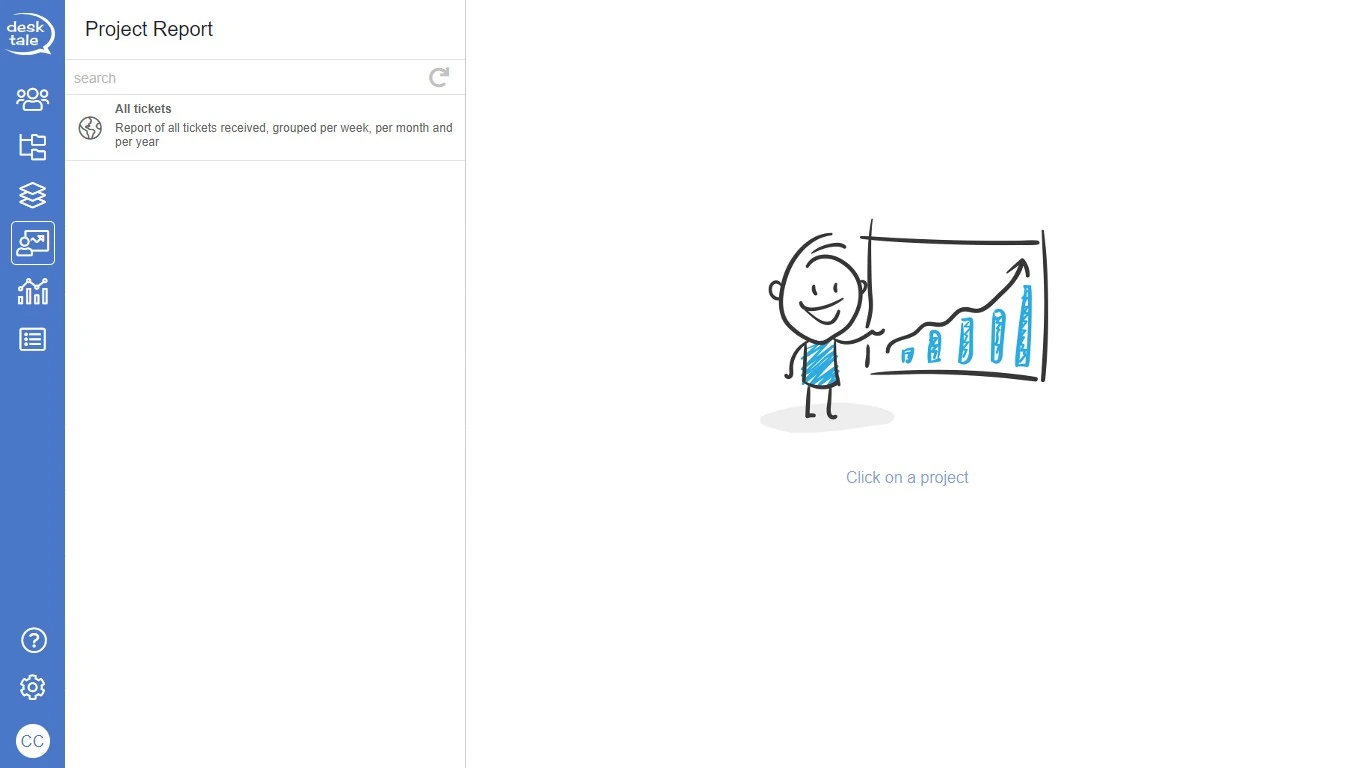
Channel reports
Click on to access the following screen.
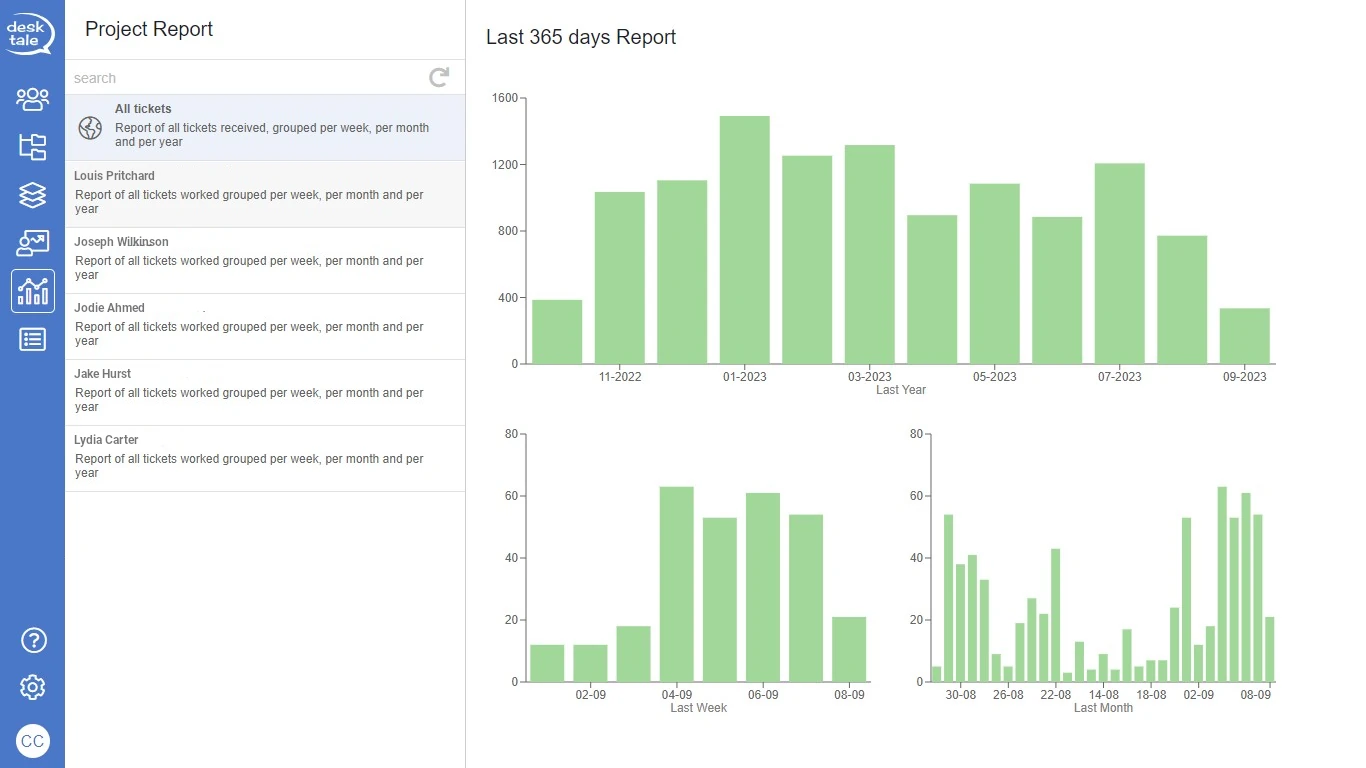
To see the report displayed, select one of the Channels from the list; in this example we’re going to open All tickets (system default chart) to view it.
In detail, you will see three different graphs in the Last 365 days Report tab:
- Last Year: grouped by each month of the past year;
- Last Month: grouped by each day of the past month;
- Last Week: grouped by each day of the past week.
By hovering each column with the mouse pointer, report details will appear.
If you wish to see the Report of an individual Channel, click on its listed item.
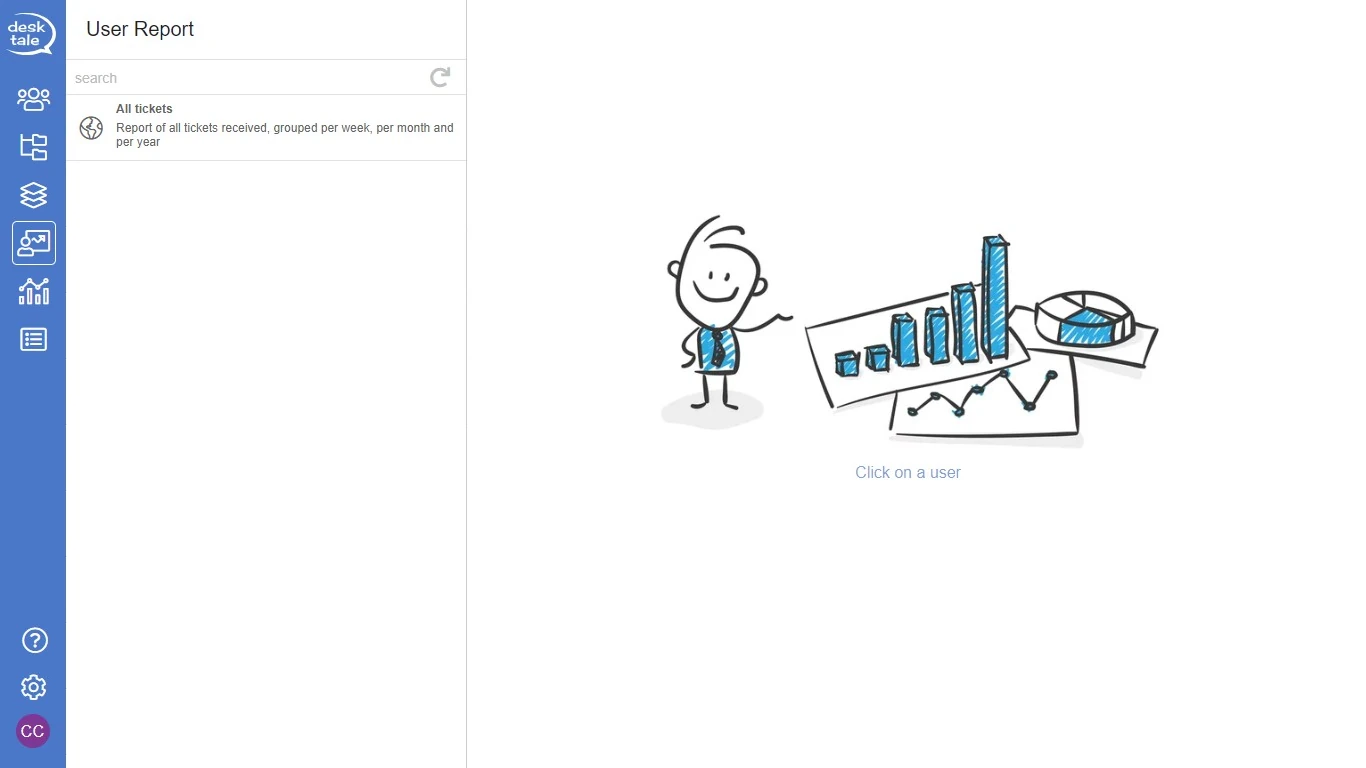
User reports
Click on to access the following screen.
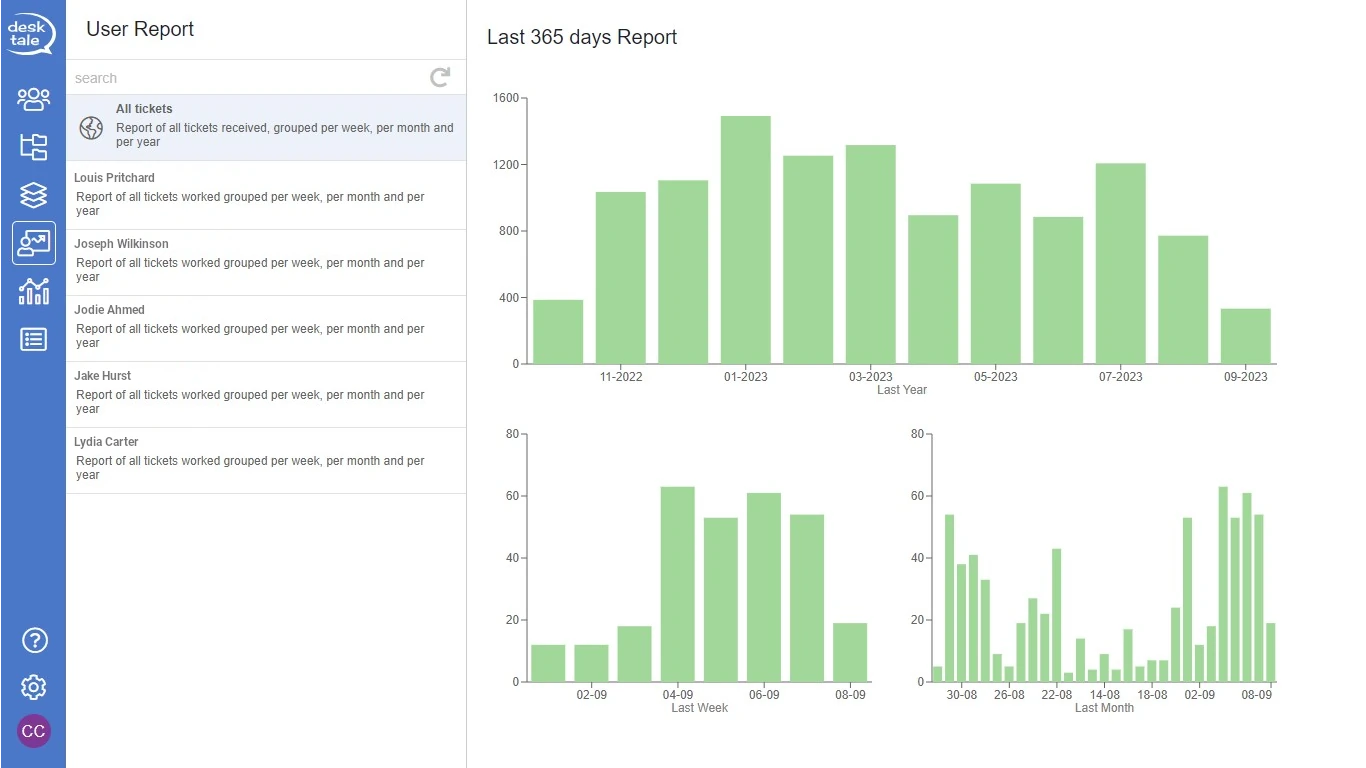
To see the report displayed, select one of the Channels from the list; in this example we open All tickets (system default chart) to view it.
In detail you will see three different graphs in the Last 365 days Report tab:
- Last Year: grouped by each month of the past year;
- Last Month: grouped by each day of the past month;
- Last Week: grouped by each day of the past week.
By hovering each column with the mouse pointer, report details will appear.
If you wish to see an individual user's Report, click on his or her listing entry.